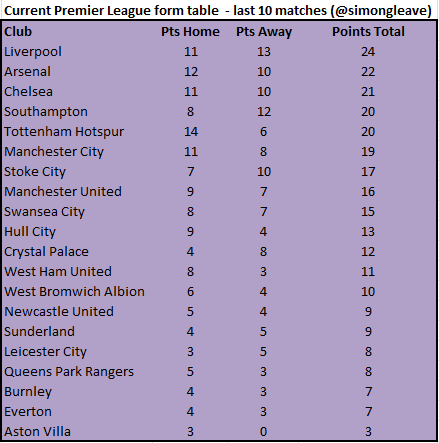
Liverpool lead the Premier League form table based on the last 10 matches with 24 points out of a possible 30 but does this really make the Reds the most in-form team? Scoreboard Journalism investigated….
League tables showing current form have been used by media for many years and, as data has become easier to store, access and distribute, a variety of league tables can now be easily published to show how teams have performed over the last few matches, the current calendar year, since a particular date etc. However, all of these tables are flawed for one simple reason – they do not take account of the relative strengths of the teams playing in the matches which make up the league table.
As the table above shows, Liverpool are currently leading the form table which covers the last 10 matches with 24 points out of a possible 30 but these raw numbers do not provide enough information as Liverpool may have just had easy fixtures during that period. The Reds would be expected to get more points from a home match against QPR than from a visit to Stamford Bridge for example.
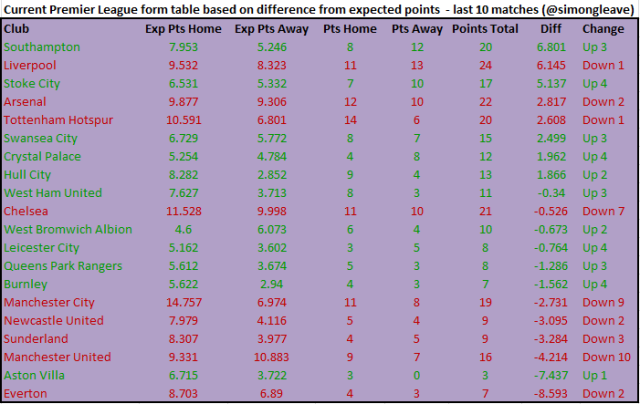
The number of points a team should have expected to get over a particular period can be calculated via a statistical model which can estimate odds like the Euro Club Index (http://www.euroclubindex.com). Turning those odds into expected points has been explained on this blog in an earlier post (https://scoreboardjournalism.wordpress.com/2012/09/01/how-to-avoid-rank-journalism-a-simple-expected-points-model/). Once expected points have been calculated, they can be compared to the points actually achieved and the differences ranked to produce a form table which takes account of how much better or worse the teams have performed in those matches compared to what would have been expected. Liverpool’s 24 points turn out to be just over six points higher than expected given the 10 fixtures played. Liverpool are therefore not the most in-form team on this basis but are beaten by one other club.
Arsenal, who are second on the raw points form table, are indeed overperforming with 22 points, 2.8 more than expected, but two other clubs – Southampton and Stoke City – have had greater levels of overachievement in the last 10 matches and move above the Gunners in comparison to the table based on raw points.
Southampton are in fact better than anyone over the last 10 Premier League matches when comparing points achieved with those that should have been expected given the fixtures. The 20 points out of 30 that the Saints achieved are actually nearly seven more than should reasonably have been expected given the opponents that they faced.
Both Manchester City and Manchester United have managed fewer points than were expected by the Euro Club Index in the last 10 matches and are therefore ranked 15th and 18th here as opposed to 6th and 8th in the more commonly used form table based on raw points. The worst team of all though is not Aston Villa with three points out of 30, as they were expected to only get around 10, but Everton with seven points instead of 16.
It is Ronald Koeman’s Southampton though who have been the biggest overachievers between the final round of matches before Christmas and last weekend (21-22 February) and therefore trump Liverpool as the best team during that period despite the Reds excellent haul of 24 points from 30, including last Sunday’s victory at St. Mary’s.


The proposed model for the league form seems to be a better representation but in reality is a bit dodgy and massively favors the underdogs. Teams with expected points 20 predicted points (top 4 contenders). So based on your model, the top teams would generally be lower placed throughout the season in this table compated to the rest of the pack and still finish comfortably above, making the form guide of minimum use. A weighted metric based on the calculated difference and aggregate expected points could be a more useful benchmark.
Agreed that it is not perfect although not quite as extreme as you suggest. Would you like to expand on your suggestion at the end please?
Won’t your suggestion if I understand it correctly make this even worse?
My suggestion is that the weights would be multiplied by a factor of the total expected points making it slightly more generalized.
Fancy having a go? If you do, I am happy to publish it here as a guest post. Get in touch with me on Twitter (address top right of this blog).
Interesting post. I like what you are doing here with the expected points however I agree that it is biased towards the underdogs.
I may look in to this further, if I do I will be sure to get back to you.
Thinking about this more, I wonder if it really matters. The point is to measure who is over- and underperforming so does it really matter that bigger teams won’t hit the top as frequently (they will if they drop a tiny amount of points). Interesting to follow and perhaps look further back. Keep watching.
I would be leery of using bookies’ odds with the assumption that they are objective expectations. Bookies’ odds give additional weight to traditional powers like Liverpool and Manchester United simply because they have a lot of fans who will bet positively to “support” their club. The fans expect that their club will win more matches than they actually do, even if the fundamentals don’t support that.
Therefore, the bookies’ odds for fashionable clubs winning give lower returns than are actually expected, and those clubs are punished under this model.
p.s. I’ve been graphing the expected top 8 clubs’ SCoRE progress over time. Well, I don’t use your data, but hand compile my own set of data every week, but it’s the same thing. You might find it amusing 🙂 http://i.imgur.com/PGpuZnE.png
Excellent. Have you got a Twitter handle that I can credit in a tweet. I did these graphs for the actual SCoRe a couple of seasons ago but this is just as nice.
I quite agree and this is exactly why I didn’t use bookies’ odds. Have another look.
Pingback: Palace v Man City: An alternative Premier League preview | Scoreboard Journalism
Pingback: Challenging the narrative: Brendan Rodgers in court | Scoreboard Journalism
Pingback: Stats and Snakeoil Awards Part 1 – Managers | stats and snakeoil
Pingback: Stats and Snakeoil Awards Part 1 – Managers | stats and snakeoil
Pingback: Another Rangers Report new feature: Expected Points v Actual Points | Rangers Report